How I Operate in the Markets
A High Level POV
Markets are dynamic; the implication is that even when one has a plan, one must plan to fail. In other words, managing risk is key. In sports, the key to success is to master the basics so that it tallies all up and you get the W at the end of the game. Hitting those singles, free-throws, playing basic defense, etc. are the way to win games. Taking what the market gives is key to success. Have a plan and be ready to amend plans on the fly but having a plan is a must.
As with all plans, we need tools and he we must know how to use them:
Price is the leading indicator, and tone setter for the rest.
Moving averages provide areas of support, resistance, and pivoting for price, as well as bias.
Ichimoku cloud provides a lane with which to contain price bias and trade selection.
Donchian channel is useful for proper trend identification.
Fair value gaps confirm market bias; the most recent gap on the biggest range frame is the most powerful and thus the determinant of market direction.
Volume weighted average price (VWAP) is a great way to assess the markets bias and whether price is respecting the current trend or if it has flipped the day’s trend.
Volume profile (VP) is the volume at price. It allows us to determine the markets’ present bias and trend. Additionally, one can extrapolate where the market is with where it potentially going. The distribution of each session and where the markets close and open relative to value tell a story that is to be followed.
An oscillator indicator is like a compass to provide us with an idea of where we are within a price range.
Volume provides clarity regarding interest in a potential market move.
Multiple time frames (MTF) provide the vantage point required to execute properly on an intraday basis. We cannot swim against the current; we must be one with the flow. This takes us back to markets being dynamic.
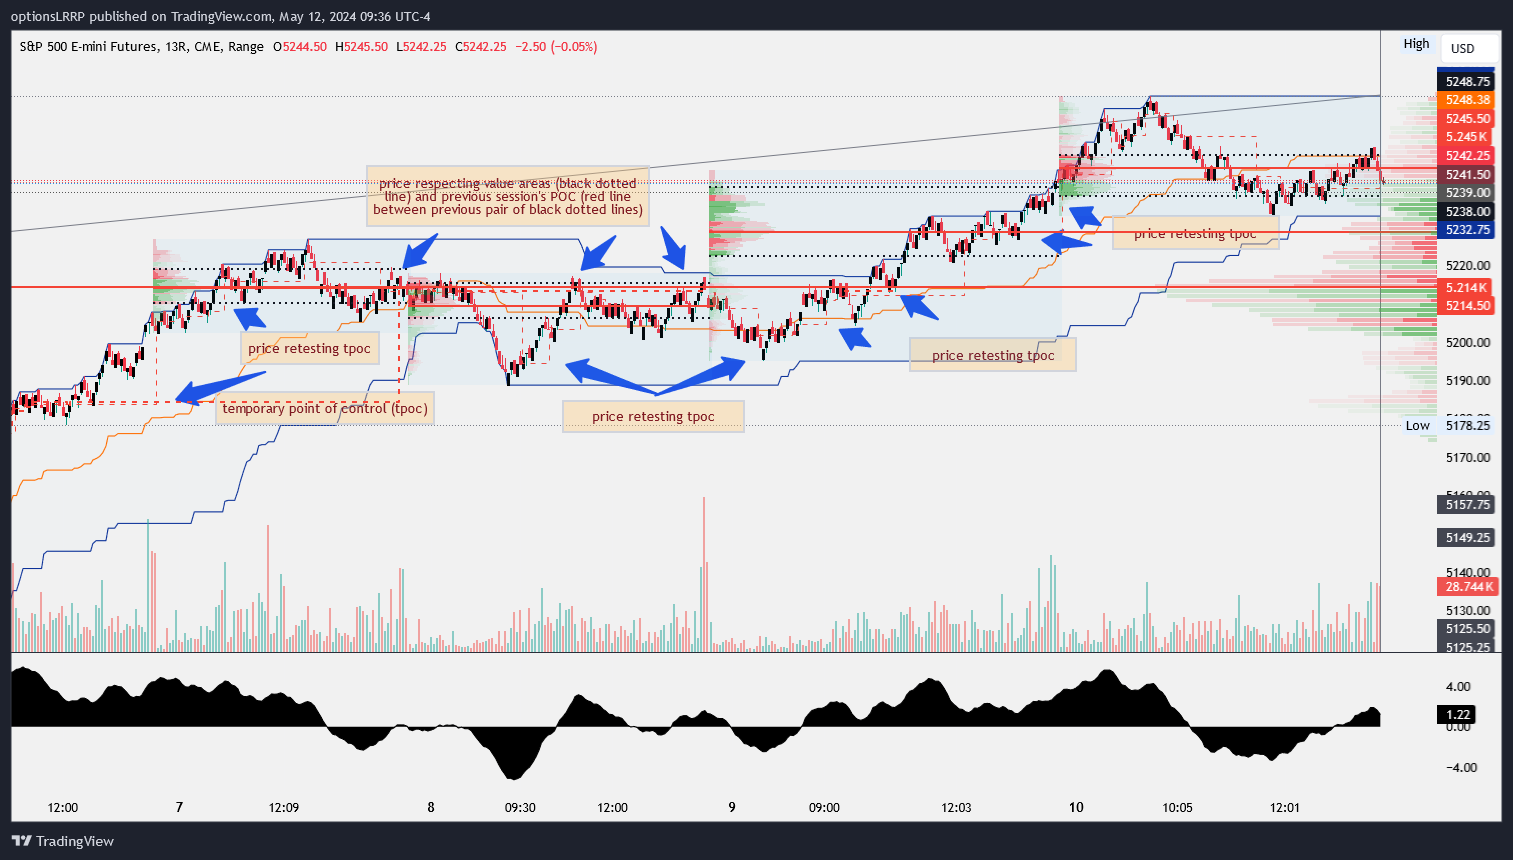
Markets trade from point of control to point of control, while traversing the highs and lows of value areas and pivoting off low volume areas. Points of control are areas where the most selling AND buying took place for a trading session; high volume areas are similar but fall short of the “most activity” qualifier. Low volume areas, which are made during transitional phases, are areas that become support or resistance at some point in the future. There is little activity in these areas as price trades fast through them. Value areas are where most of the trading activity took place for a trading session. Typically, the percentage of activity analyzed is two standard deviations, or 68% of the trading activity in a price range. During and after value areas are set, price tends to respect the levels, and this is where we get price rotations from.
Review the below images to make sense of the above.