

Daily Plan: 4.18.2024
Daily Plan: 4.18.2024 (needs to be updated)
Previous RTH (Regular Trading Hours) levels
O: 17,959.50
H: 17,959.50 (0930hrs EDT)
L: 17,615.25 (124630hrs EDT)
C: 17,665.50
VAH: 17,775.00
POC: 17,695.75
VAL: 17,634.00
Previous Overnight levels
Open:17,940.00
High: 17,968.50(092740hrs EDT)
Low: 17,778.00 (0204070hrs EDT)
VAH: 17,946.25
POC: 17,916.25
VAL: 17,888.75
Overnight levels
Open: 17,669.75
High: 17,712.50(2214440hrs EDT) bold need to update before publication
Low: 17,669.75 (0204070hrs EDT)
VAH: 17,946.25
POC: 17,916.25
VAL: 17,888.75
(17673.00 as of 1508hrs EDT) Chart 1 shows that the session for 04172024 yielded a trend day which was in line with the expectation per the analysis for the day. The session’s profile is distributive or showing multiple points of distribution whereby price continued in one direction, marked by the blue arrows on chart 1. Compare the two distributions on chart 1, the sessions for both 04162024 and today, 04172024. The distributive areas are in the 17,000 range in parentheses (940-910, 858.25-828, 802-782, 758-727,717-680, 655-635). At 143715hrs EDT, some type of buy program was initiated to drive price to test VWAP. Of course it proceeded to reverse back to make new lows. At 1530hrs EDT, VAH = 17831.25, POC = 17709.50, and VAL = 17630. At 1600hrs EDT, VAH = 17825.00, POC = 17704.50, and VAL = 17632.50.

Given the daily time frame breaking several critical levels – 9ema (18,200), ichimoku cloud support (17,650), 18,000 – there are reasons to be on the stalk for shorts moving forward daily. Of course, nothing moves in a straight line, so retracements are in the game. In addition, the market has generated a sell system based on today’s price activity – the yellow line with a dash marked by the blue arrows, per chart 2. This is the first sell signal since August 2023, which prompted the sell off into the end of 2023.
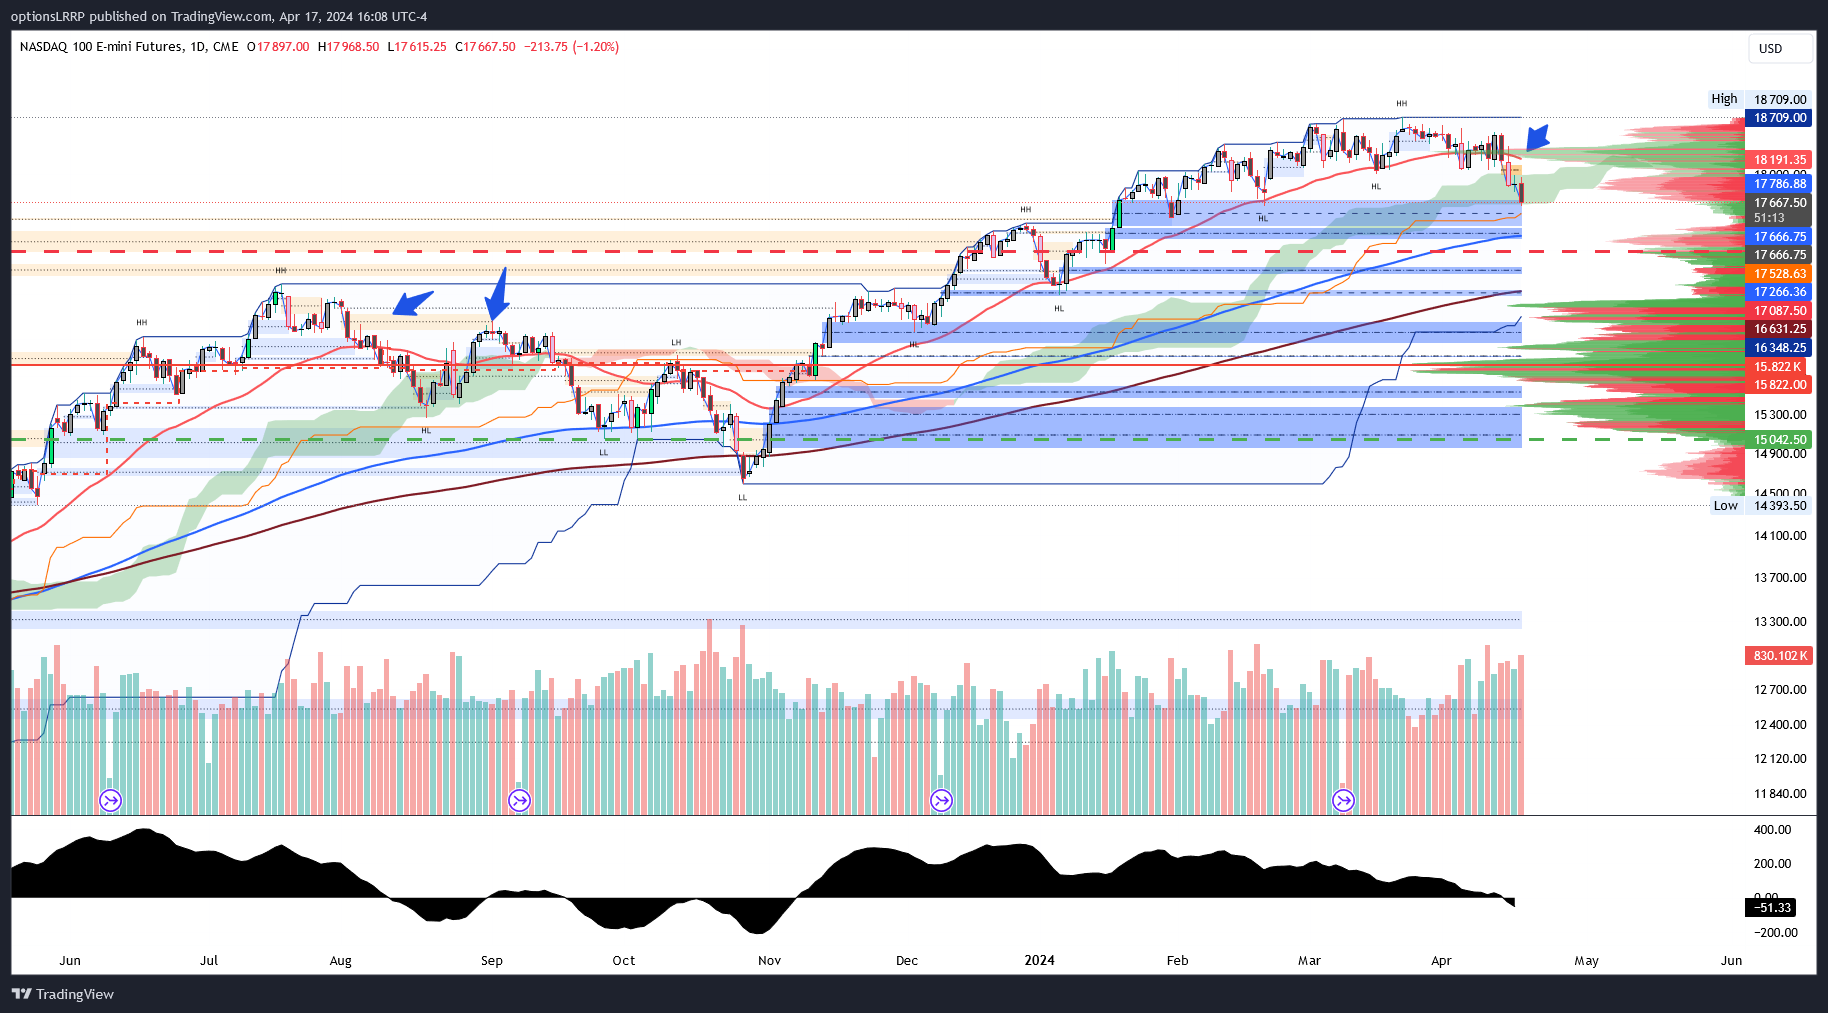
Chart 3 shows how all the balanced distributions lend themselves to tactful market entries with the proper perspective. Given the recent price action and the globex open within the RTH value area of 634 and 775. It is fair to presume the market is drastically imbalanced toward the sell side and a retrace is potentially in the cards before any continuation. Additionally, chart 3 shows a positive divergence which is playing out thus far with an RTH low of 615.25 and an overnight low of 669.50 so far.

Chart 4 shows the market profile levels for the overnight session so far: VAL is 675, VAH is 695 and the POC is 681. Referring to chart 2 and considering the value areas for the RTH session (775, 695, 634), along with the positive divergence, the sum is a bullish tone as the market has some upside auction levels to clear out that are a function of the sell imbalance that is present in the market.

As outlined by the market text in chart 2, the market began to sell off at 968.50, which lends the 940 area is a representative POC for that area to lean on if market retraces that far from its current 720 level (225216hrs EDT). Longs look good versus a near test of yesterday’s VWAP at 17,780, which coincides with the previous overnight low of 778 and VAH of 775. If the market happens to continue, then a complete repair of the sell imbalance is potentially in the cards which could lead to a retrace to 915, which coincides with the previous overnight POC at 916.50.
The overnight target is 780 with potential resistance at 740. Level 2 target 840, with a final potential target of 890. These levels are a function of an expectation tied to short selling and how markets trade via the auction process.